August 15, 2026 · Three.js · AI
Building an AI-Ready Debugging System for a Three.js Village
A 3D scene becomes hard to debug when its important state is hidden in the render loop. I built Scene Lab, a Test Kit, and the Observatory to make the village inspectable by people, browsers, and AI agents.
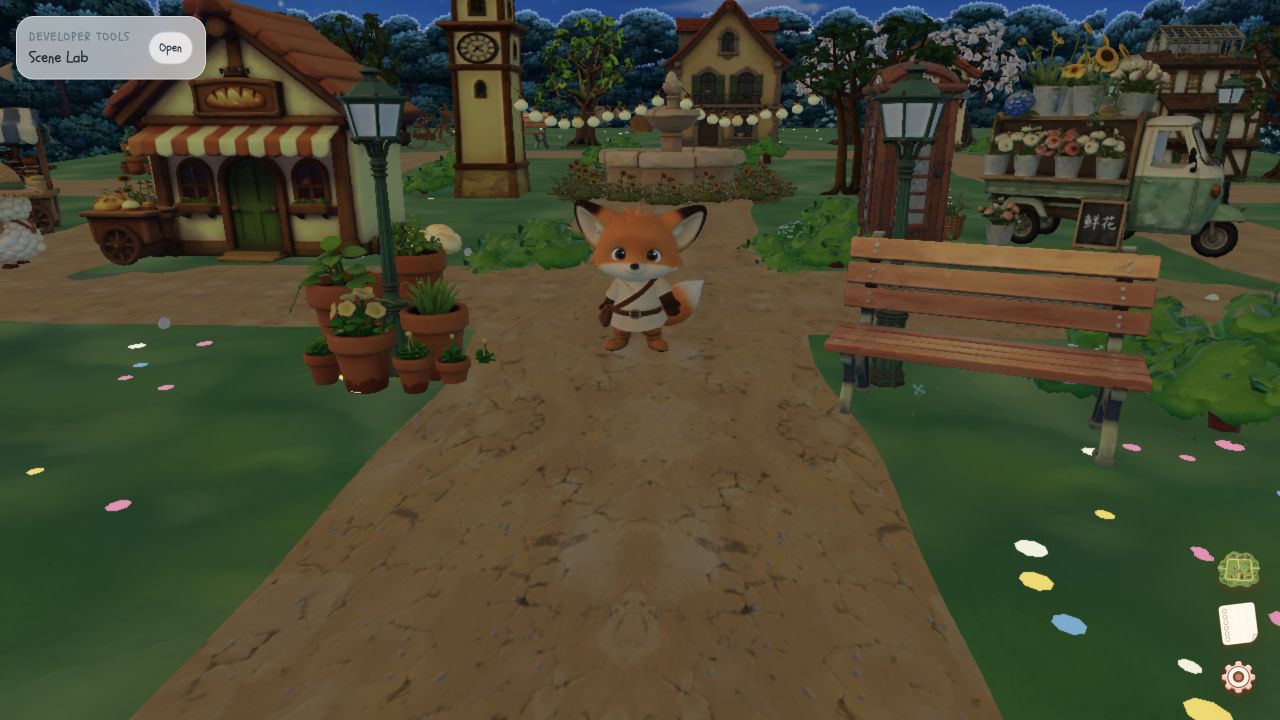
The village at 3d.sakshikale.com is designed to feel calm. Its engineering problems were not.
Once the scene had a character, curved roads, animation, shadows, HTML overlays, map travel, environment changes, and mobile behaviour, “it sometimes feels janky” became the least useful bug report I could receive. The same visible hitch could come from player movement, a React commit, a texture upload, a shadow update, a camera cinematic, a browser lifecycle event, or the debugging panel itself.
The more capable the village became, the less a screenshot could explain. So I built a control room beside it: tools that make the running world inspectable, give failures a repeatable shape, and publish enough state for a human or an AI agent to investigate without guessing.
A Three.js Canvas Is Opaque by Default
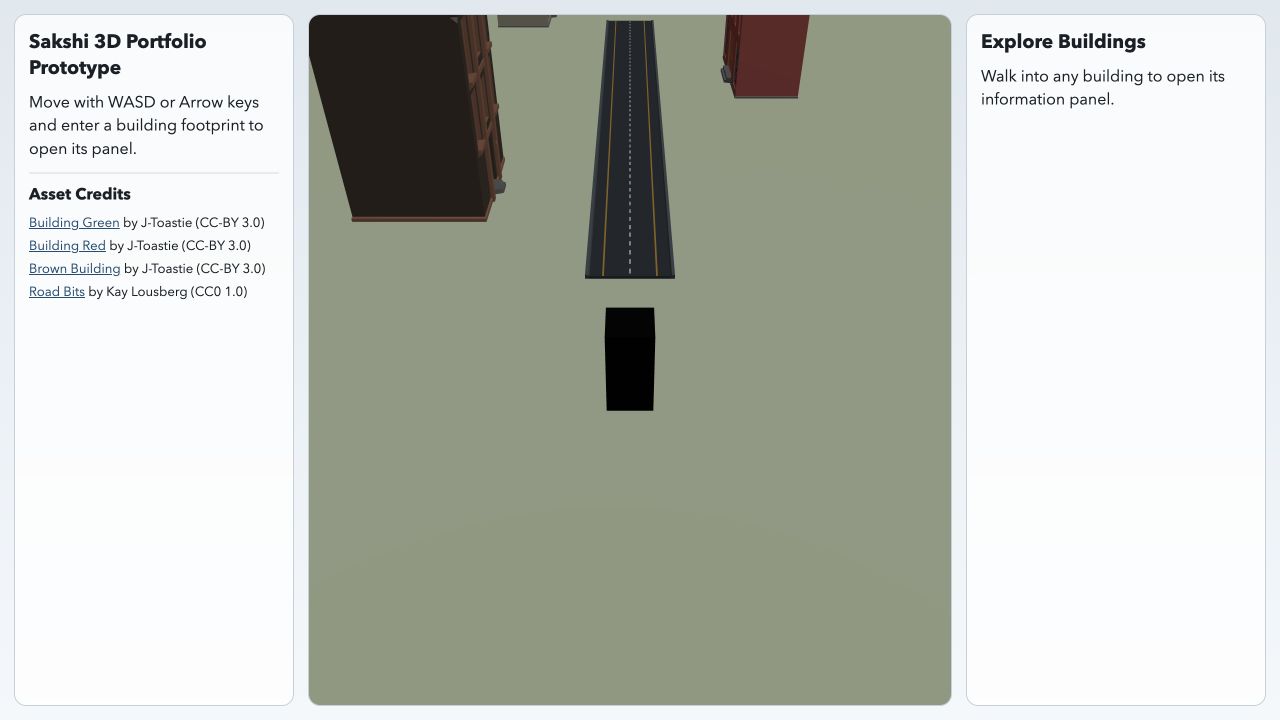
Most of the state that matters in a real-time 3D application does not appear in the DOM. It lives in transforms, animation mixers, collision verdicts, camera state, GPU resources, texture updates, and per-frame hooks. The Canvas shows the final pixels, but it does not explain how those pixels were produced.
That makes a visual check necessary but insufficient. A screenshot can show whether a model overlaps another model, whether the camera composition works, or whether a character appears to float. It cannot prove that a collider redirected the player correctly, that an input command was consumed, that an HTML prompt did not rerender the Canvas, or that an environment switch avoided another GPU upload.
The same limitation matters even more in AI-assisted development. An AI agent can inspect code, DOM nodes, and a screenshot, but it should not have to infer the live state of a Three.js world from pixels or improvise a route with arbitrary key presses. Every additional screenshot, coordinate guess, page scan, and fixed wait is another unreliable loop. Debugging tools are therefore not only developer conveniences; they are the interface an AI needs to reason about the running application honestly.
Scene Lab Turned Hidden State Into Controllable Experiments
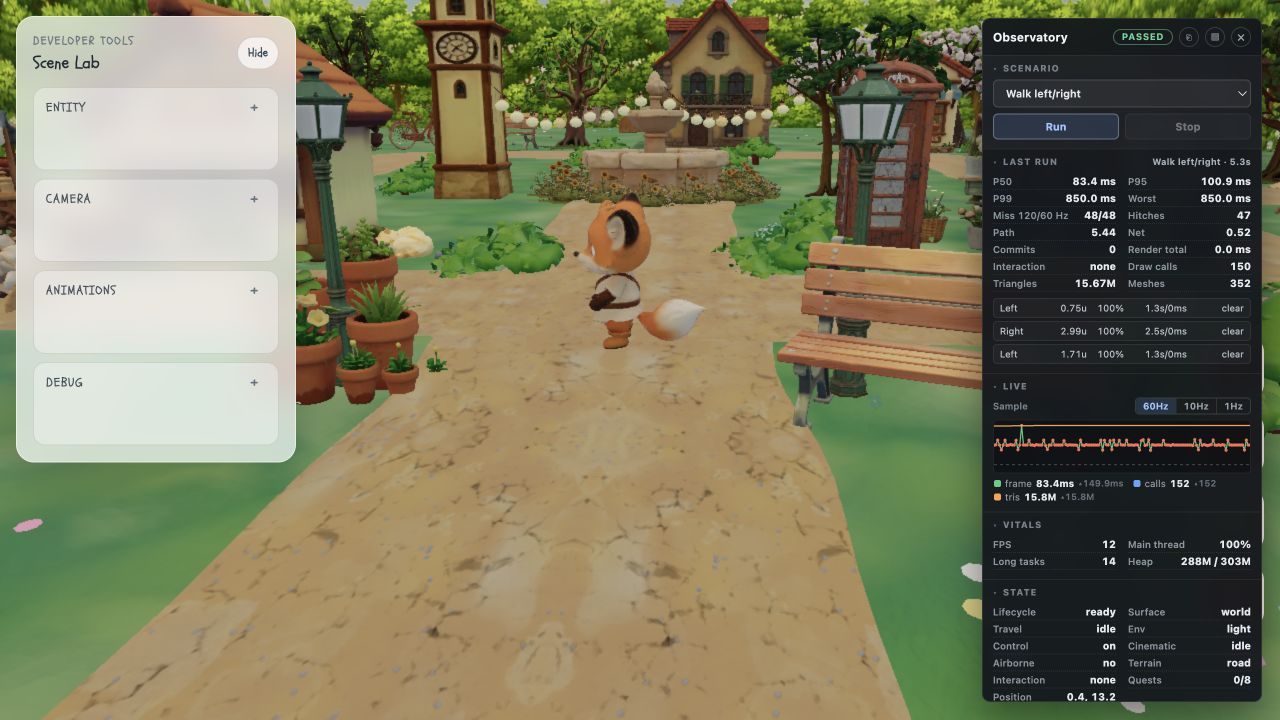
The first tool was Scene Lab. It exposes camera composition, model placement, animation clips, playback speed, model bounds, grounding markers, shadows, collision boxes, and environment controls while the scene is running.
It was also a direct scene editor. I could select an entity, drag it across the X/Z ground plane, adjust its transform, rotate it around Y, resize its visual footprint, and override its collider size. Those overrides feed the same collision system as the authored scene configuration, so the editor did not create a separate pretend world. It let me test what actually happens when a building, prop, or interaction moves.
Scene Lab could preview animations on different entity types, not only the player. I could force an animation clip, change playback speed, and inspect whether the visible motion, bounds, and ground contact agreed. The authoring camera could also move beyond the normal visitor-facing follow restrictions, making it possible to inspect occlusion, framing, and collision relationships from angles a visitor would never see.
This changed the kind of question I could ask. Instead of editing code, refreshing, and hoping I had recreated the same conditions, I could isolate one variable: force a walk animation while the player stayed still; show the model bounds and ground marker together; move an object while watching its collision footprint; change a shadow policy while keeping the rest of the scene stable.
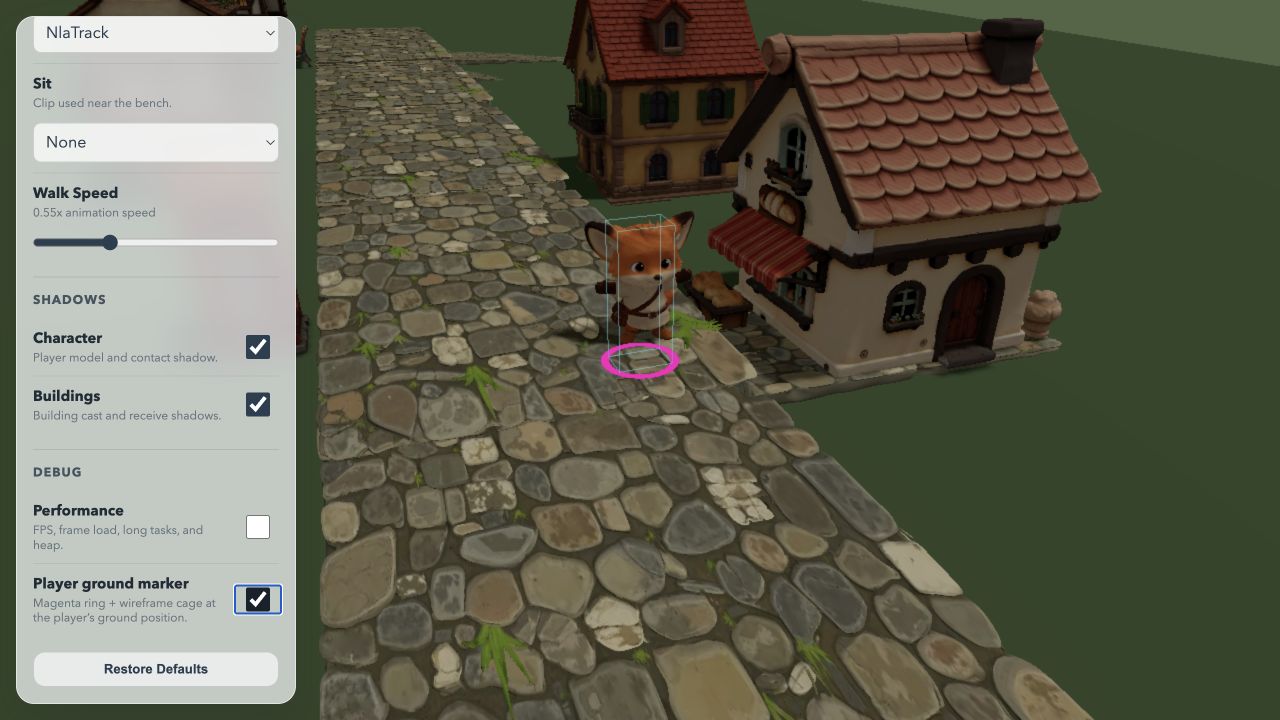
For Foxy, this mattered because visible animation, transform position, collision footprint, and ground contact are separate facts. If its feet appeared to float, an image with the animated model, bounds, and grounding marker was much more useful than an ordinary beauty shot. Scene Lab did not fix the bug by itself. It made the disagreement visible enough to form a real hypothesis.
Named Scenarios Replaced Improvised Input
Manual input is a poor benchmark. “Walk around for a while” does not define a route, a starting point, a duration, or a success condition. Two runs may use different paths, miss a key release, begin before assets are ready, or complete less work while appearing faster.
The Test Kit turns common questions into named scenarios: walking routes, collision checks, approaching an interaction, rapid alternating input, idle rendering, passing behind a street lamp, and environment switches. Each scenario has a stable ID, a start policy, a declared workload, an expected outcome, and integrity checks.
The start policy comes from the same scene configuration the application uses. A collision test approaches the actual bookstore or cat rather than copying world coordinates into a separate script. An interaction test derives its location from the real interaction metadata. When the authored world changes, the test follows the world instead of becoming a stale coordinate puzzle.
The workload also enters through the same external input channel consumed by player locomotion. This is important: the test is not a second physics implementation that predicts what the app should do. It drives the real mechanics while removing unreliable keyboard focus and timing from the experiment.
For a rapid-direction scenario, 80 transitions are issued over a fixed frame window. I only interpret frame-time or React results after the scenario confirms that the commands were consumed and the intended physical and presentation transitions occurred. A performance test that silently performs less work is not a passing test.
The Observatory Correlated Runtime State With Render Work
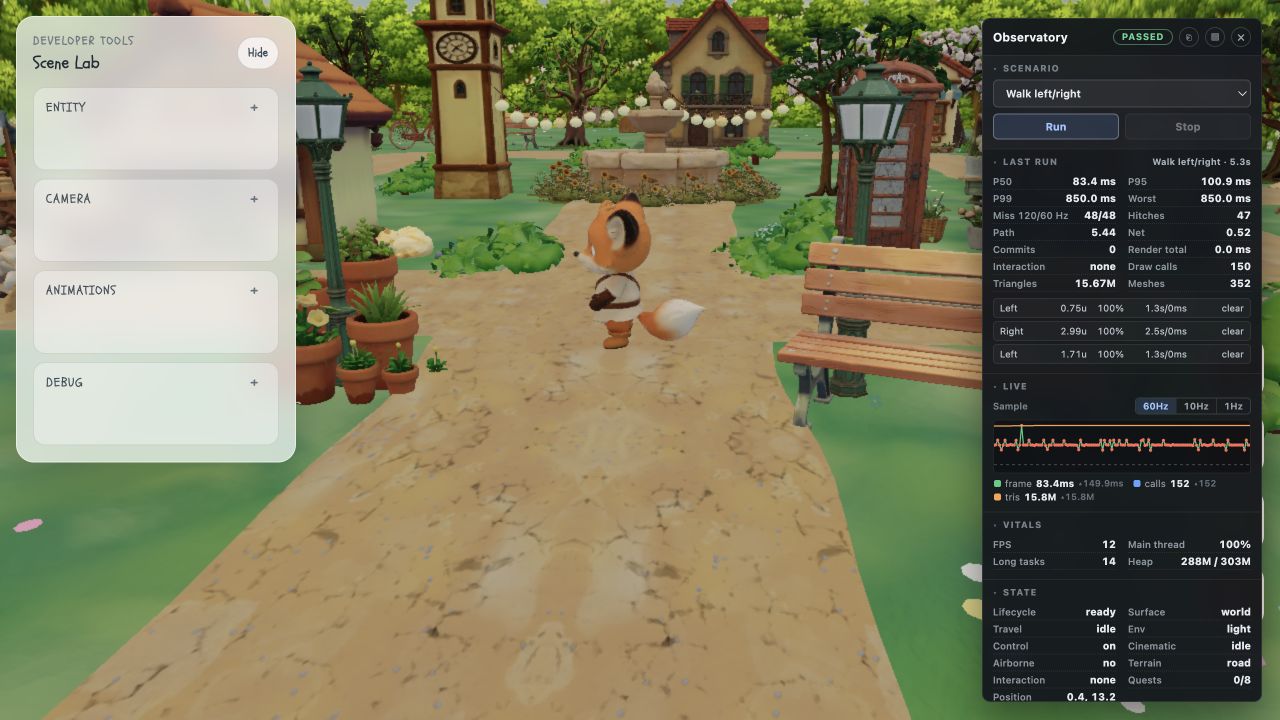
An FPS counter can tell me that a frame was expensive. It cannot tell me whether the player was moving, an overlay opened, a cinematic changed the camera, the environment switched, a texture returned to the GPU, or a shadow path started submitting work.
The Observatory puts those clues next to each other. It records frame-time information, renderer counts, application state, player and travel state, a short event history, and the results of named scenarios. It makes a time-based performance signal useful by placing it beside the state transition and workload that produced it.
That made specific engineering questions testable:
- Does rapid physical input require a React presentation commit for every tiny pause?
- Does opening a nearby HTML action reconcile the persistent 3D composition?
- Does switching a cached environment variant upload a texture again?
- Does a declared collision or route complete without hiding a workload failure?
The answers are scoped to named runs and their saved evidence, not vague claims that the whole site is “optimised.” The control room lets the project preserve what happened, in which environment, under what workload, and what the result can actually support.
AI Agents Need a Public Debugging Surface
AI can be useful in a complex codebase, but it should not become the source of truth about a running 3D scene. The job of the app is to expose the right evidence so the agent can choose the right test and report the result with its limitations.
The Observatory publishes a stable, versioned snapshot that advertises the available scenarios, controls, lifecycle fields, panel status, and typed run result. An agent begins from one bootstrap locator, discovers what the app can currently do, selects an advertised scenario, runs it, waits for a terminal status, and reads the complete result.
That is a much stronger interface than asking an agent to search for selectors, hold an arrow key for an estimated number of milliseconds, and inspect a screenshot. It removes repeated page-wide scans, hard-coded coordinate discovery, arbitrary sleeps, and private access to React or React Three Fiber state. New scenarios are discoverable from the application rather than requiring every browser driver or AI workflow to be taught another custom command.
Readable app state matters just as much. The application publishes whether the scene is ready, which surface is active, whether player control is enabled, which interaction is active, what travel phase is in progress, and whether the player is grounded or airborne. An agent can then distinguish “the player did not move because controls were disabled” from “the player was blocked by a collider,” rather than guessing from one frame.
This is an important design principle for the AI-assisted generation of software: build tools that reduce ambiguity before asking an AI to diagnose it. Stable controls, explicit state, repeatable workloads, and focused diagnostics make the experience easier to debug for a person, a browser runner, and an AI agent at the same time. The agent becomes an investigator of evidence, not a narrator of plausible guesses.
One Failure Report Is Better Than Continuous Polling
An investigator needs detail when a test fails, but streaming every internal value every frame would make both the application and the AI loop worse. The Observatory therefore keeps a bounded recent-event history and offers one diagnostic report containing the player position, current state, and relevant events.
The normal workflow stays compact: run a scenario, wait for its terminal status, read the typed result, and collect diagnostics only when there is something to explain. That reduces both telemetry overhead and reasoning overhead. A short causal record is more useful than an unbounded stream of unrelated values.
This also keeps the evidence hierarchy clear. Images are for visual claims. Source code is for hypotheses. A named scenario is for a stated behavior. Retained measurements are for performance claims. Browser and device runners are for lifecycle and environment behavior. A green badge is never a universal statement that the application is healthy; it means that one declared workload met one declared criterion.
A Browser Observes What the Canvas Cannot
The in-page tools understand the village’s own concepts: its scene entities, player state, collision policy, travel phases, and scenario catalog. Browser-level runners observe different things: focus, visibility, navigation, renderer restarts, process memory, and the behavior of a particular browser engine.
The two layers share a public contract instead of reaching into private state. The application publishes readiness, controls, scenario status, and results through meaningful controls and state attributes. Chrome and Mobile Safari runners drive the same declared workflows while contributing the environment-level evidence the Canvas cannot see.
That separation matters on mobile. A narrow desktop viewport cannot prove that Mobile Safari will preserve memory, survive repeated navigation, or handle visibility changes correctly. The project uses the control room to keep the app’s internal behavior inspectable, then uses browser runners to test the runtime around it.
The Village and the Control Room Are One Project
I began by learning how to make a world people could walk through. I learned how to place models in a Canvas, move through world space, follow a player with a camera, manage assets, and map a 3D village into a readable navigation system.
Building the debug tools deepened that learning. Scene Lab taught me to expose and compare visual state. The Test Kit taught me to define workloads rather than compare impressions. The Observatory taught me to connect renderer cost to application behavior. Making those tools legible to AI taught me that good automation starts with a self-explaining system.
The live village is at 3d.sakshikale.com. The control room is the reason I can keep changing it with more confidence.